Reference Audio / Monitoring
When producing recorded music we would all like a finished recording that “translates,” (sounds good), on as many different audio systems as possible. This is our goal. A “professional” recording, right? Something that stands up, at least sonically, to other professional recordings. (A good song, arrangement, and performance are all a whole other matter.)
In order to have a recording that compares to other professional finished recordings, sonically at least, we need a way to compare what we are doing to those great recordings that have come before us. We need a reliable system that when used, will produce a professional level finished recording that translates again and again.
If you have been in audio a while, (or like me a long while), you are waiting for me to tell about the magic monitoring system I use or recommend. That you should buy this set of speakers or that.
To flash back in time when I was mastering CDs in the late nineties and early two thousands, I had an elaborate full range system with dual 15” sub woofers, custom three way top monitors, Carver magnetic field power amps, and all fine tuned with a 32 band eq using a spectrum analyzer and reference microphone. The system was awesome! The room itself was treated with bass and tube traps that eliminated early reflections and the comb filtering that goes with it. I loved it!
Am I going to suggest that you should buy and set up such a system in order to make professional recordings and mixes. Definitely not.
Going way way back in my recording and mixing experience, in the early days, I would mix something in my studio and I thought it sounded good and balanced in my studio. Then I would make a cassette copy of it and play it in the car and it didn’t sound right. Many times it was too “bassy” or not enough top end. Bottom line it didn’t have the final frequency curve and balance that a professional recording had of that day.
The key to a professional mix that translates to a variety of audio devices is two things, overall frequency curve, and level. And when I say “level” I mean the overall compression level or LUFS. Loudness Units Full Scale. Another way to think about level or “loudness” is the density of the audio. Getting these two things right or within professional tolerances is what we are looking for. (Keep in mind that these “professional levels” and expectations for overall “loudness” vary depending on musical genre).
So the frequency curve portion of this key ingredient brings us back to monitoring or speakers so we can hear, or “monitor,” the frequency curve the music is producing. This is why an accurate monitoring system has always been desirable. But how often can we have a full range kick ass monitoring system?
In my audio journey I have only been back recording, mixing, and mastering the last few years. As I was restarting my audio work once again, and acquiring new equipment, I knew I was not going to have an ideal monitoring system and that almost all my work would be through headphones. I knew I would need another way to produce reliable professional results with just headphones.
So I went to work to figure things out. My first step was to take a bunch of popular songs from CDs and rip the tracks I wanted into wave files to drop into my DAW.
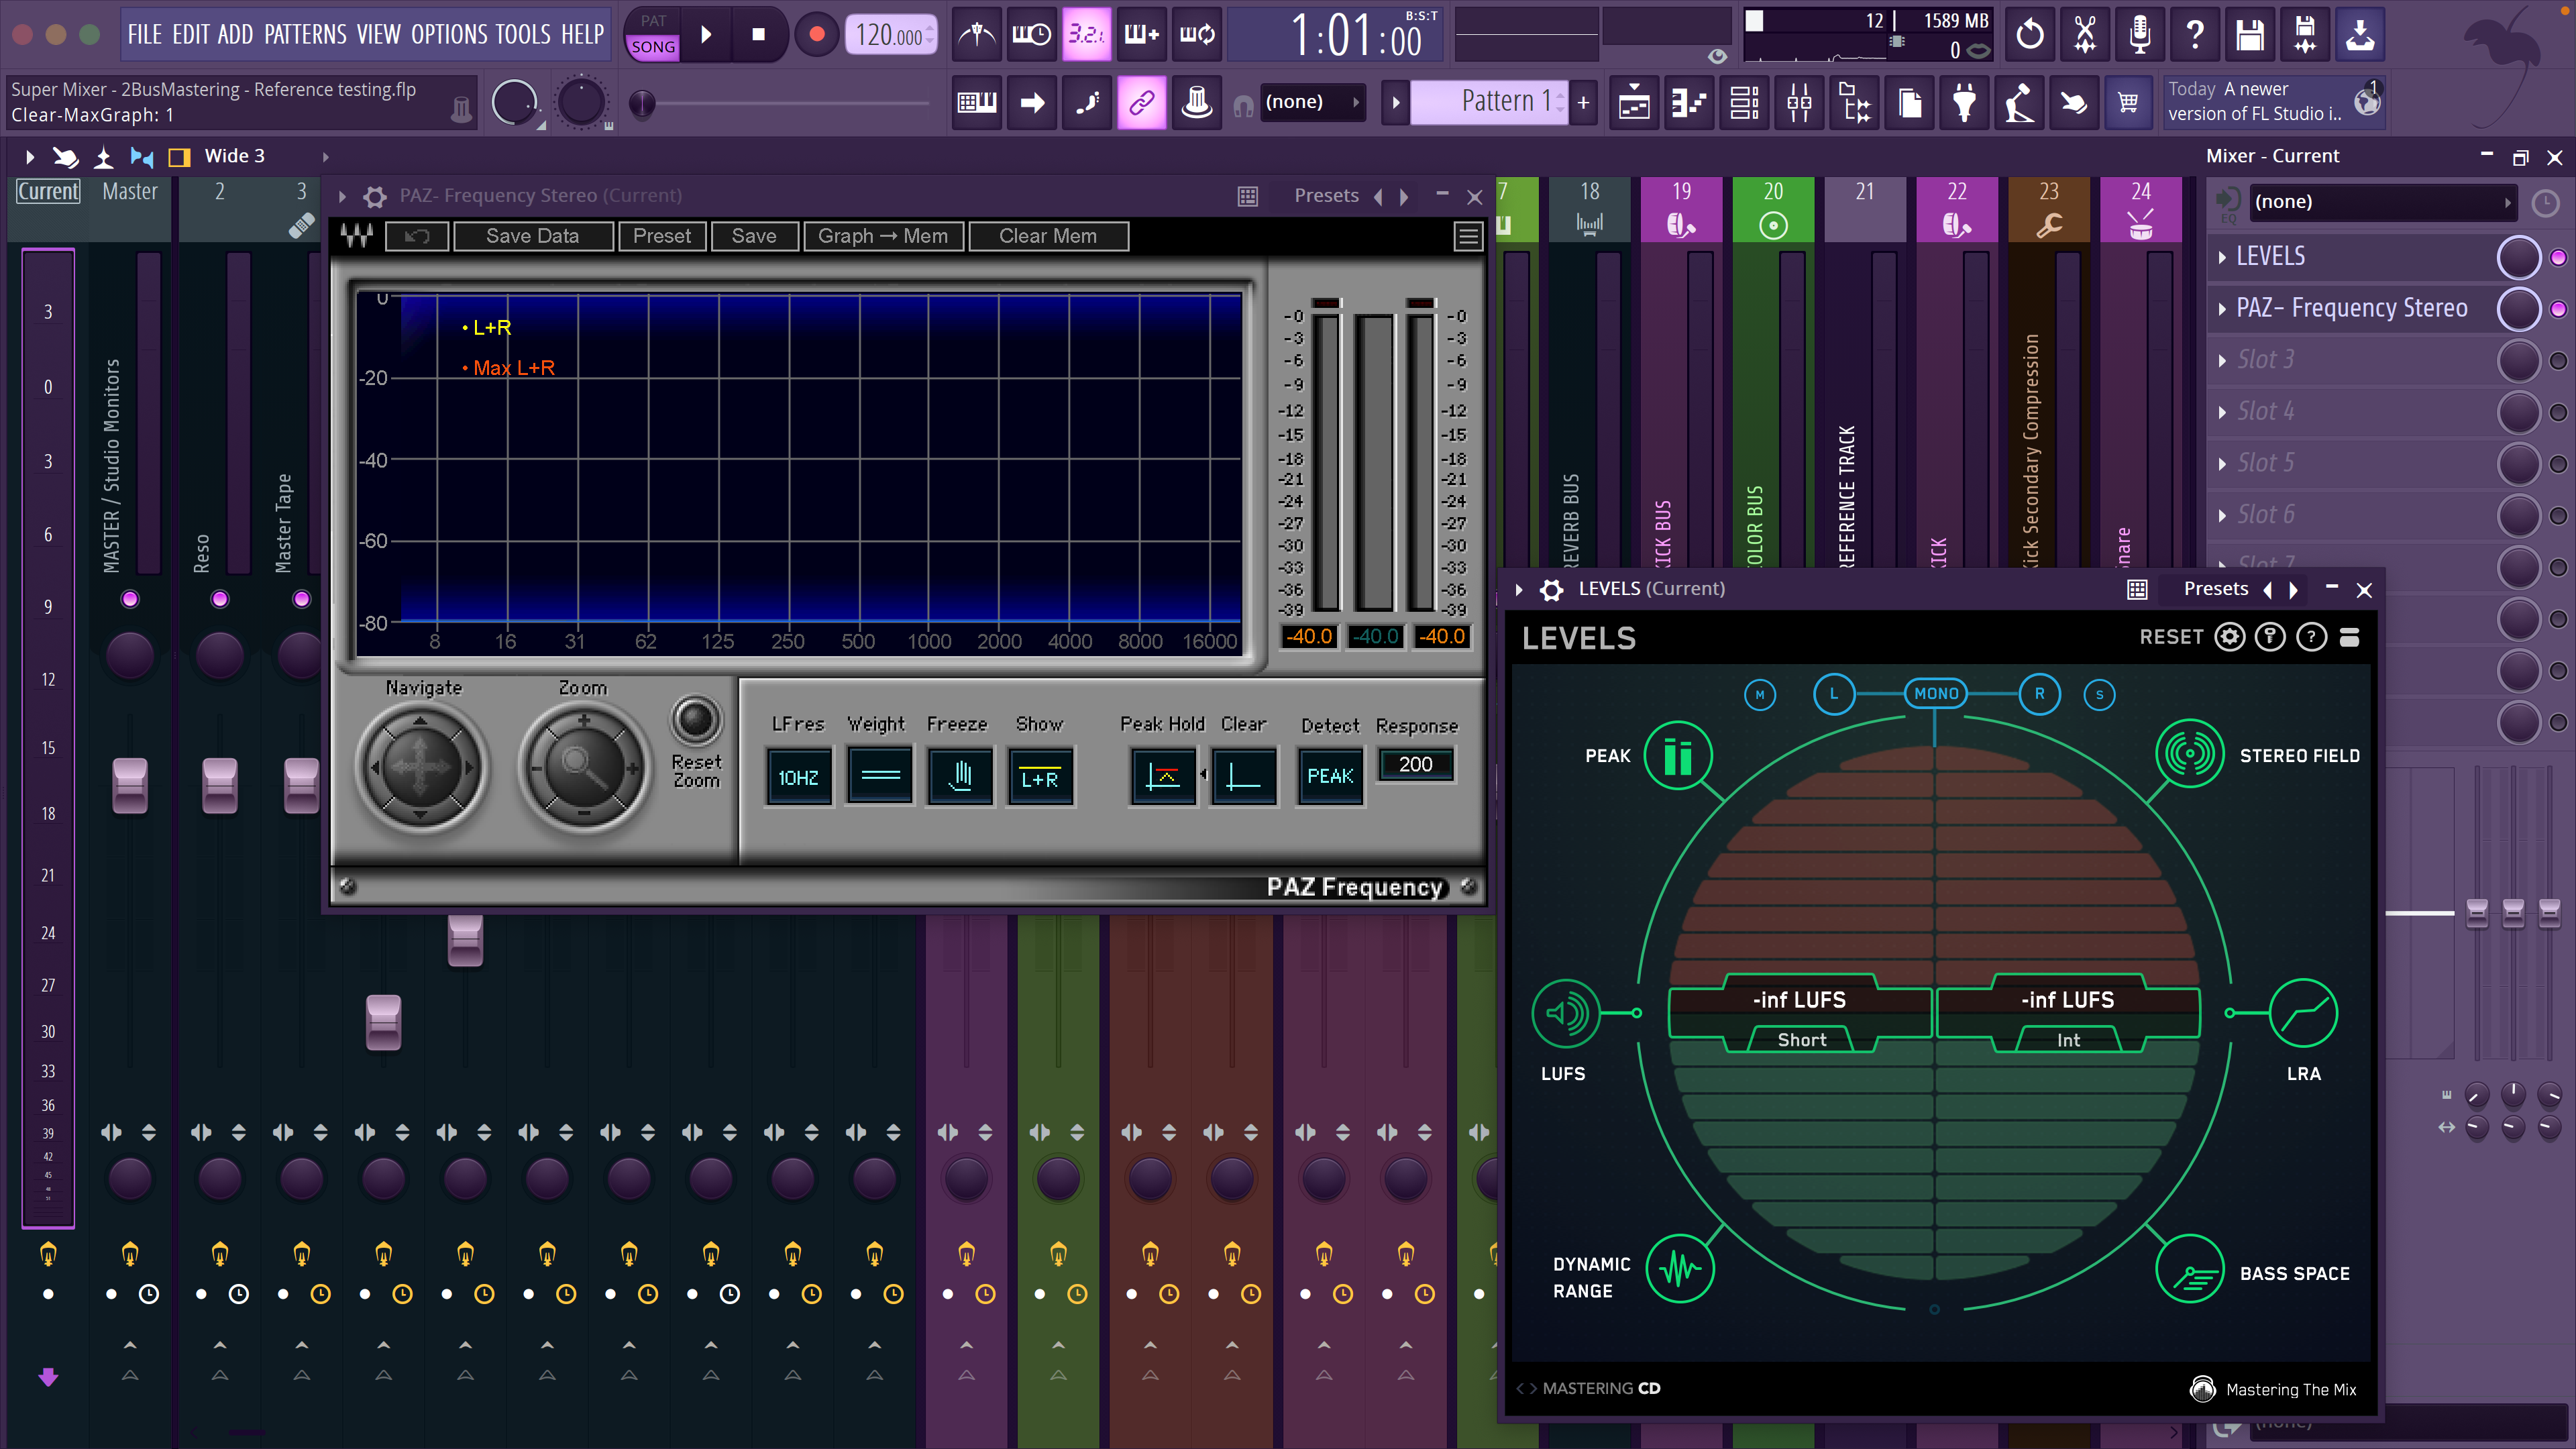
In my DAW template or “console,” that I designed, in the current channel effects rack I placed a frequency analyzer plugin and a levels meter plugin. This would give me the feedback I needed to get the right frequency curve and loudness level I was looking for.
But what was I looking for?
This is where the CD tracks come in. In my DAW I have a channel set up for reference tracks that usually come from the client, so that I have a scratch mix to compare to as I am mixing a new song. On this channel, in an otherwise empty template, I place a professionally produced track and route it directly to the main output channel. No processing or level change.
Then I play the entire tack and monitor the LUFS and frequency curve. The analyzer saves the highest point, (level), of each monitored frequency, so after the song is over, we can now screenshot the results and analyze the frequency balance of the track and see the highest point, (in red), each frequency hit. We can also see the average LUFS level the song achieved.
After we repeat this process over and over again, with several hit songs, we start to see a pattern develop. We notice a similar frequency curve from track to track from a variety of artist.
Let’s start to analyze and compare the results.
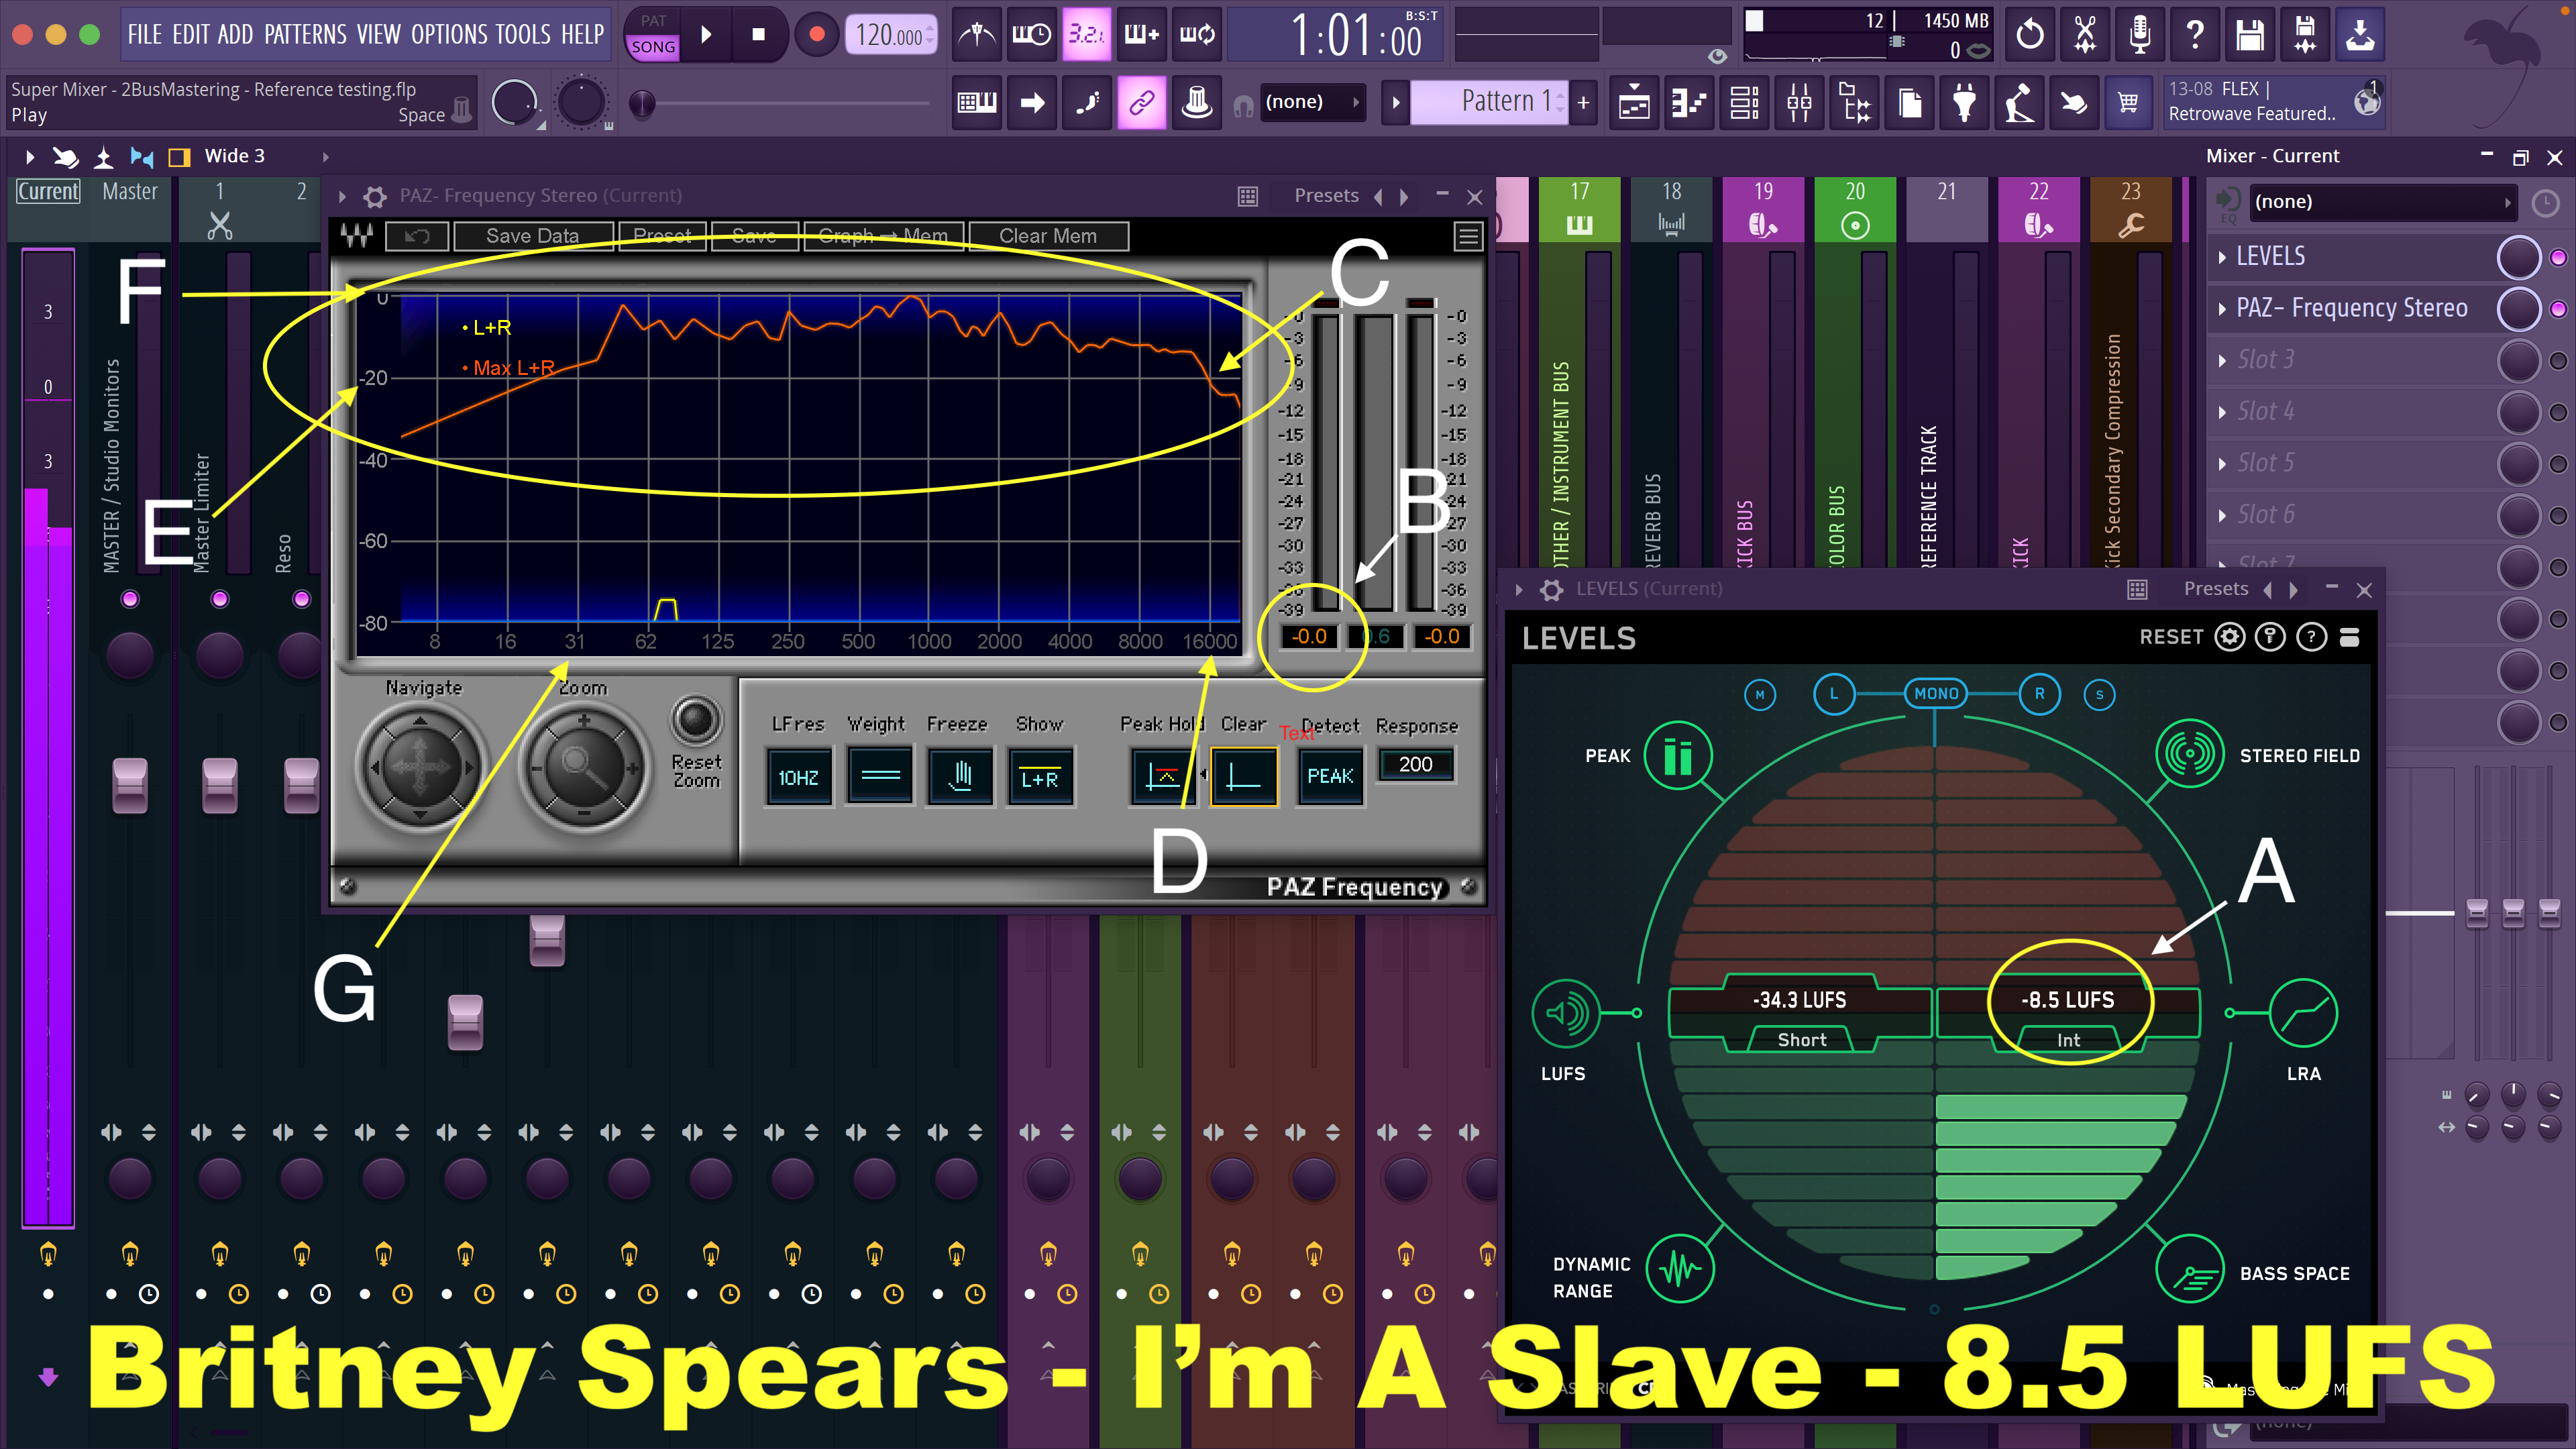
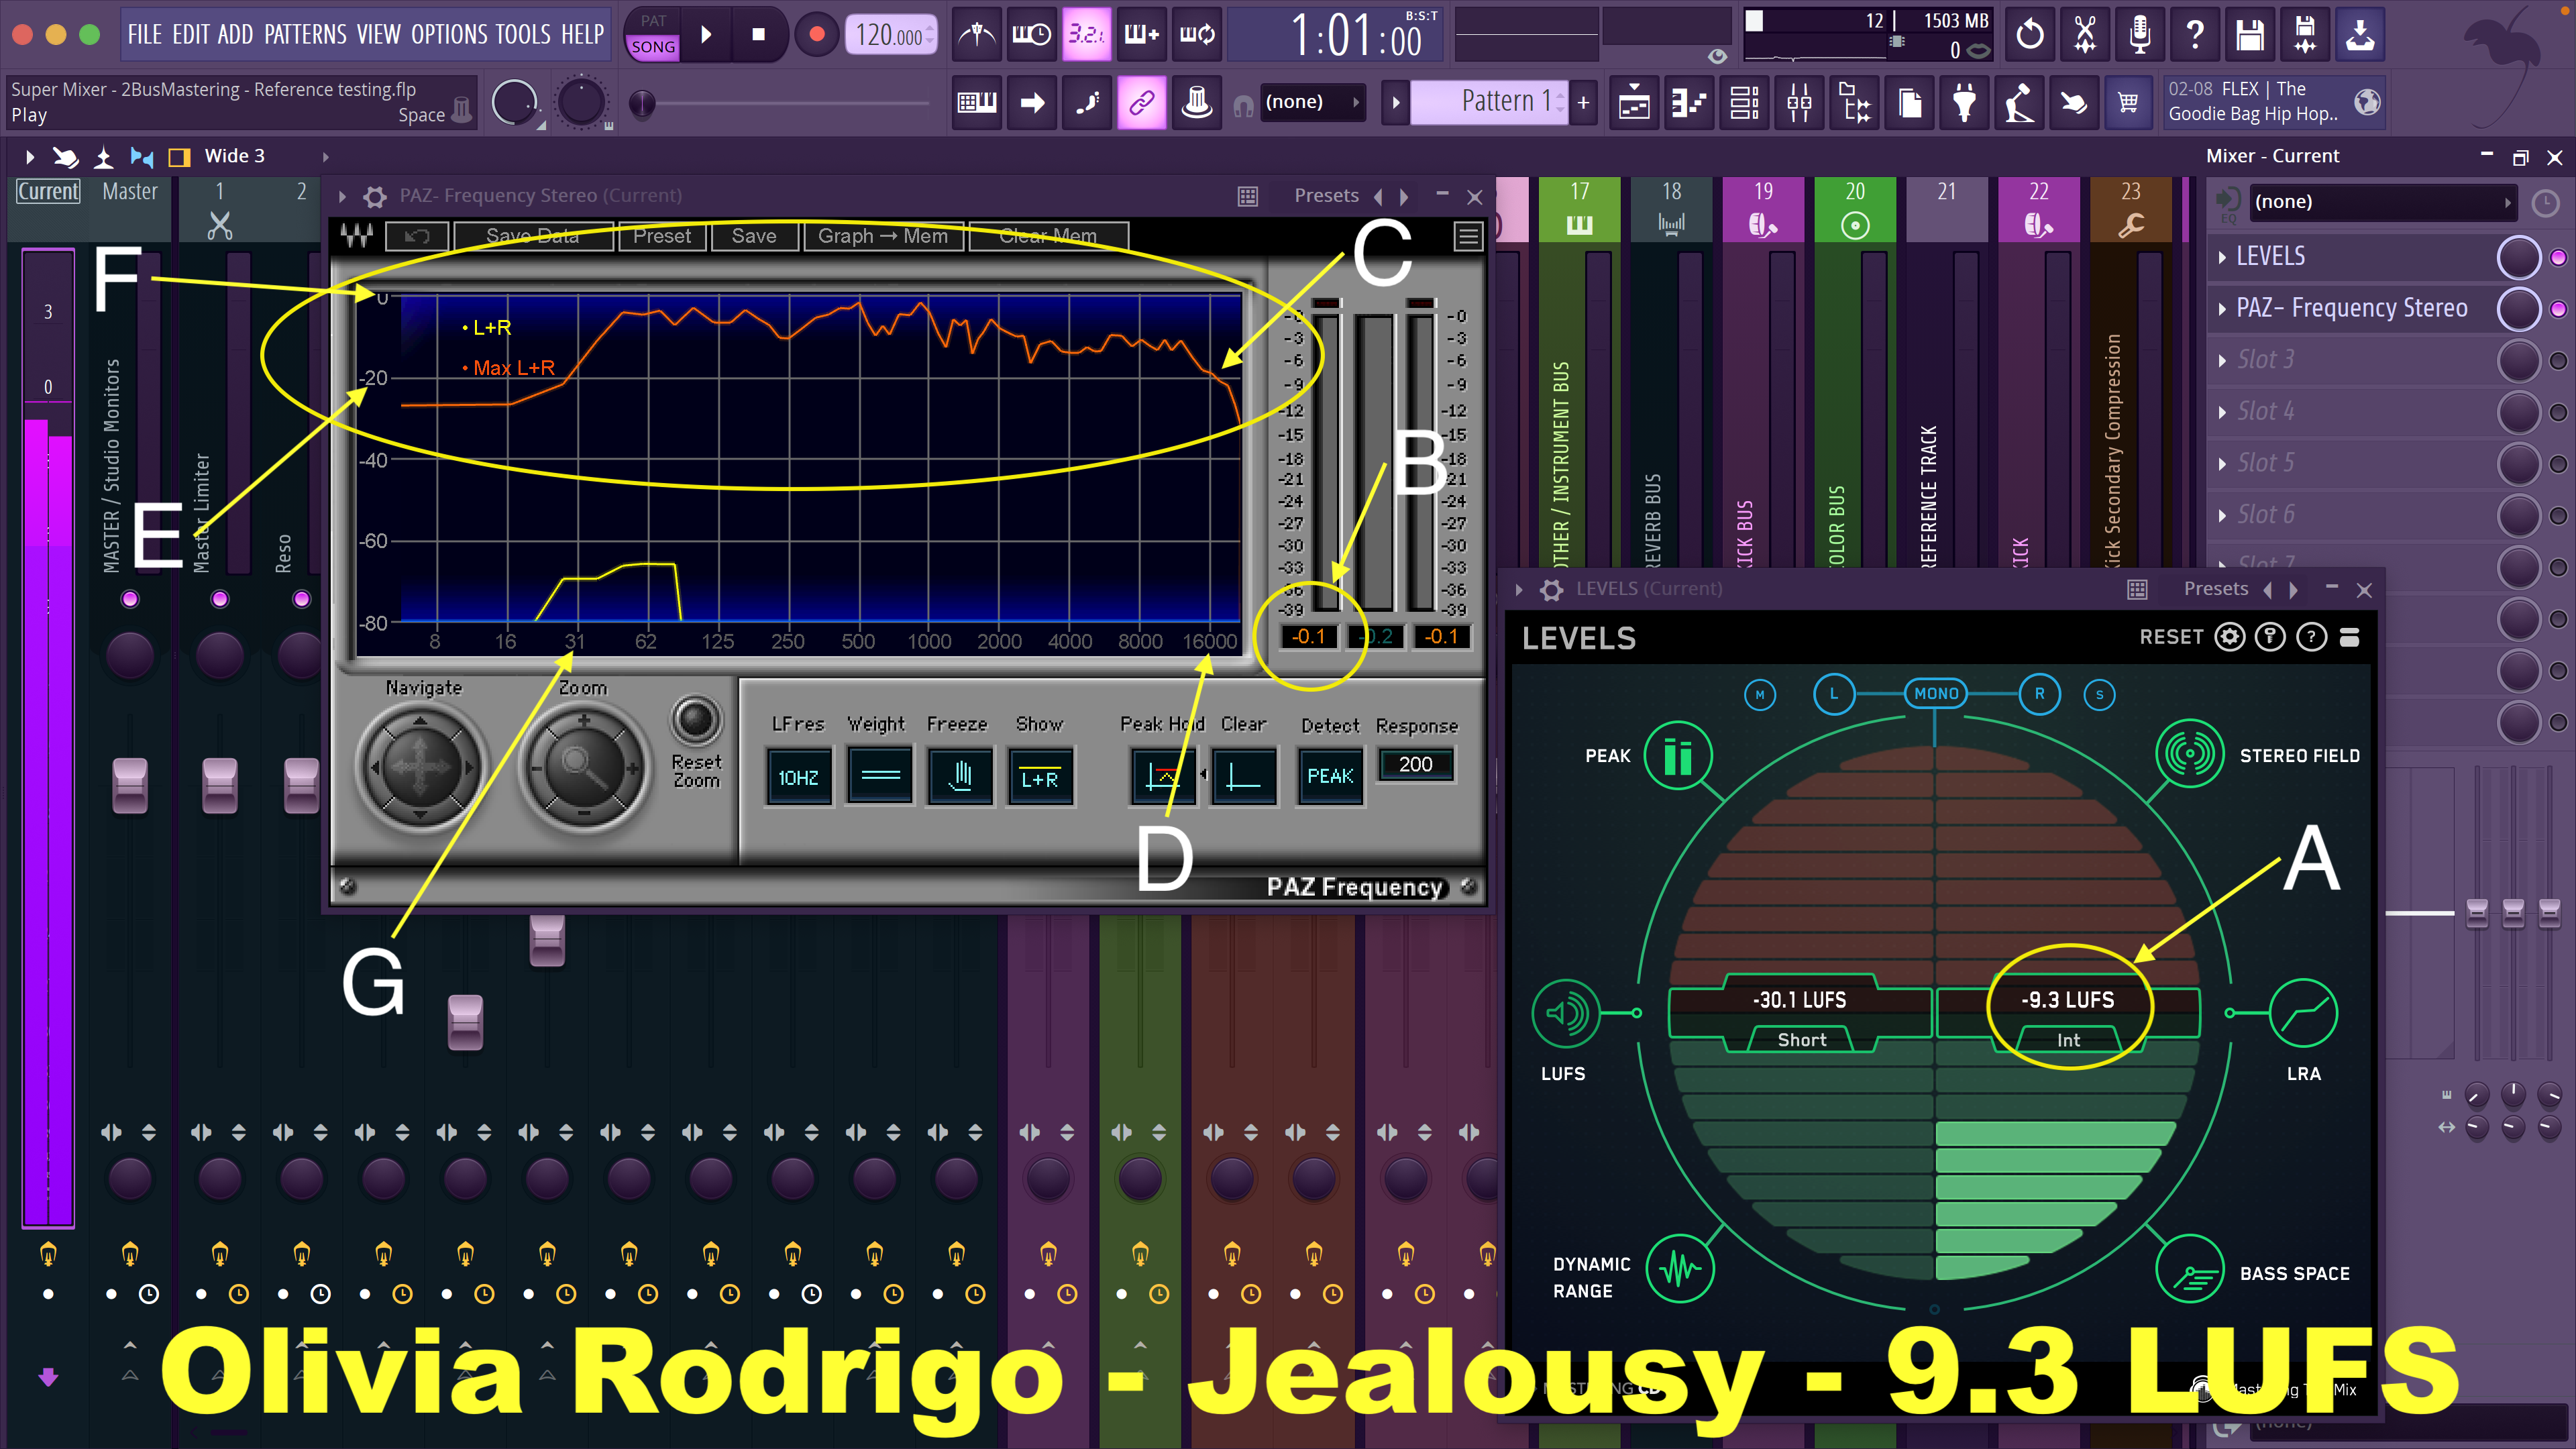
Let’s first break down what the letters are and what they are pointed at:
NOTE: To see these images better you may want to right click on an image and open them in another window on your desktop or laptop, or zoom in on them on your phone screen.
“A” is pointed at the average LUFS level of the track. (This first example is at -8.5 LUFS) Keep in mind that the higher the number the louder or more compressed the mix is. (However we are working with negative numbers so -5 LUFS will be louder than a track that is at -14 LUFS). All of our comparisons here are done with CD audio releases.
“B” is pointed at the peak digital db level. Many tracks will top out at “0”, some will be at -0.1, others will be at -1.0 and many other slight variations like, -0.2 or -0.5.
“C” is pointed at where the high frequency curve crosses 16,000 khz.
“D” is pointed at the 16,000 khz marking on the frequency grid.
“E” is pointed at the -20 db level line on the frequency grid.
“F” is pointed at the 0 db level line on the frequency grid.
“G” is pointed at the 31 hz marking on the frequency grid.
The RED LINE on the frequency grid is the MAX signal level of each frequency achieved over the length of the song. When you start listening to songs and watching the movement of the frequency analyzer, you will see the movement of the dynamics of the song and the dynamic range each song has. As we analyze these tracks, we will only be comparing these MAX signals that determine the frequency curve of the overall track.
As we compare these tracks we will uncover similarities between them and that will in turn help us to setup the levels and a frequency curve we want to shoot for with our mixes.
One of the reasons to do this is because any particular speaker monitoring system may or may not reproduce the song’s frequency curve accurately where the analyzer will be perfect every time. Most speakers have the hardest time getting a good and accurate bottom end. This is why many times when getting a track to master the bottom end level of the track is usually the section of the frequency curve that is off the most.
Let’s look at another track.
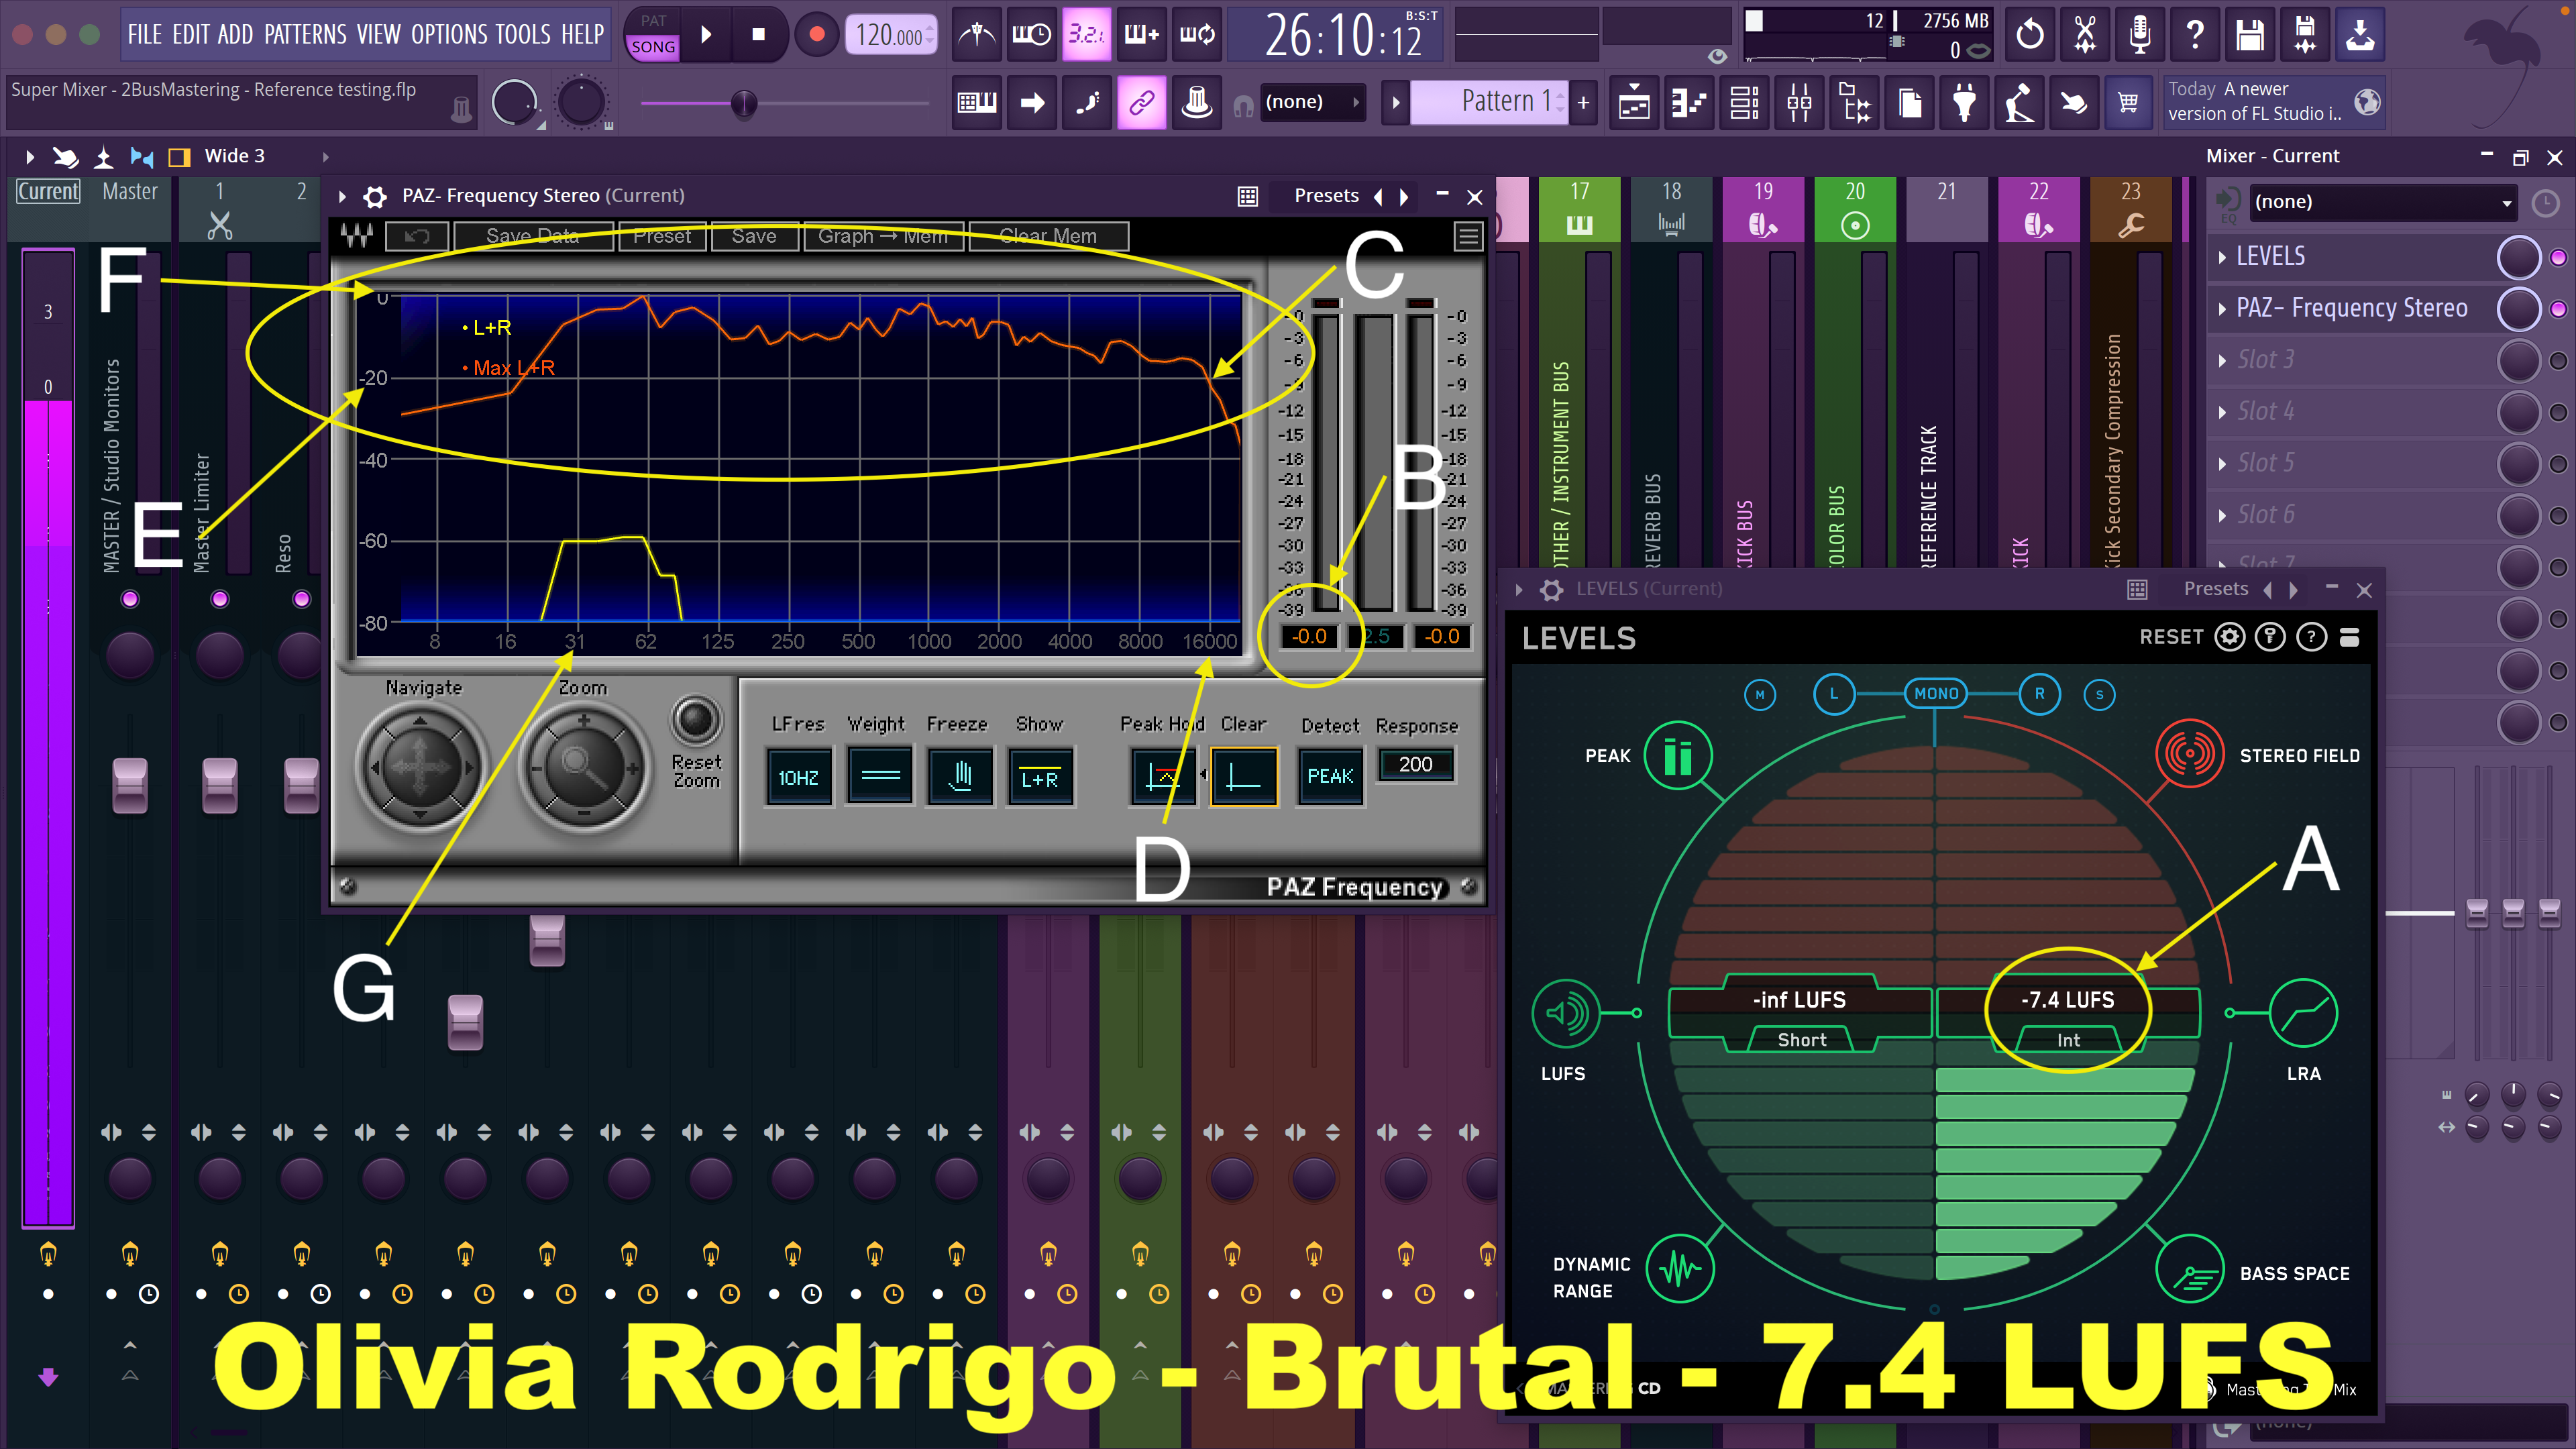
This track by Olivia Rodrigo is about 1 LUF louder than than the first example by Britney Spears. These pop tracks are a recording generation away from each other, but share a common frequency curve. In both examples, look where the max red line crosses 16,000 khz being down to about -20 db.
Let’s take another one.
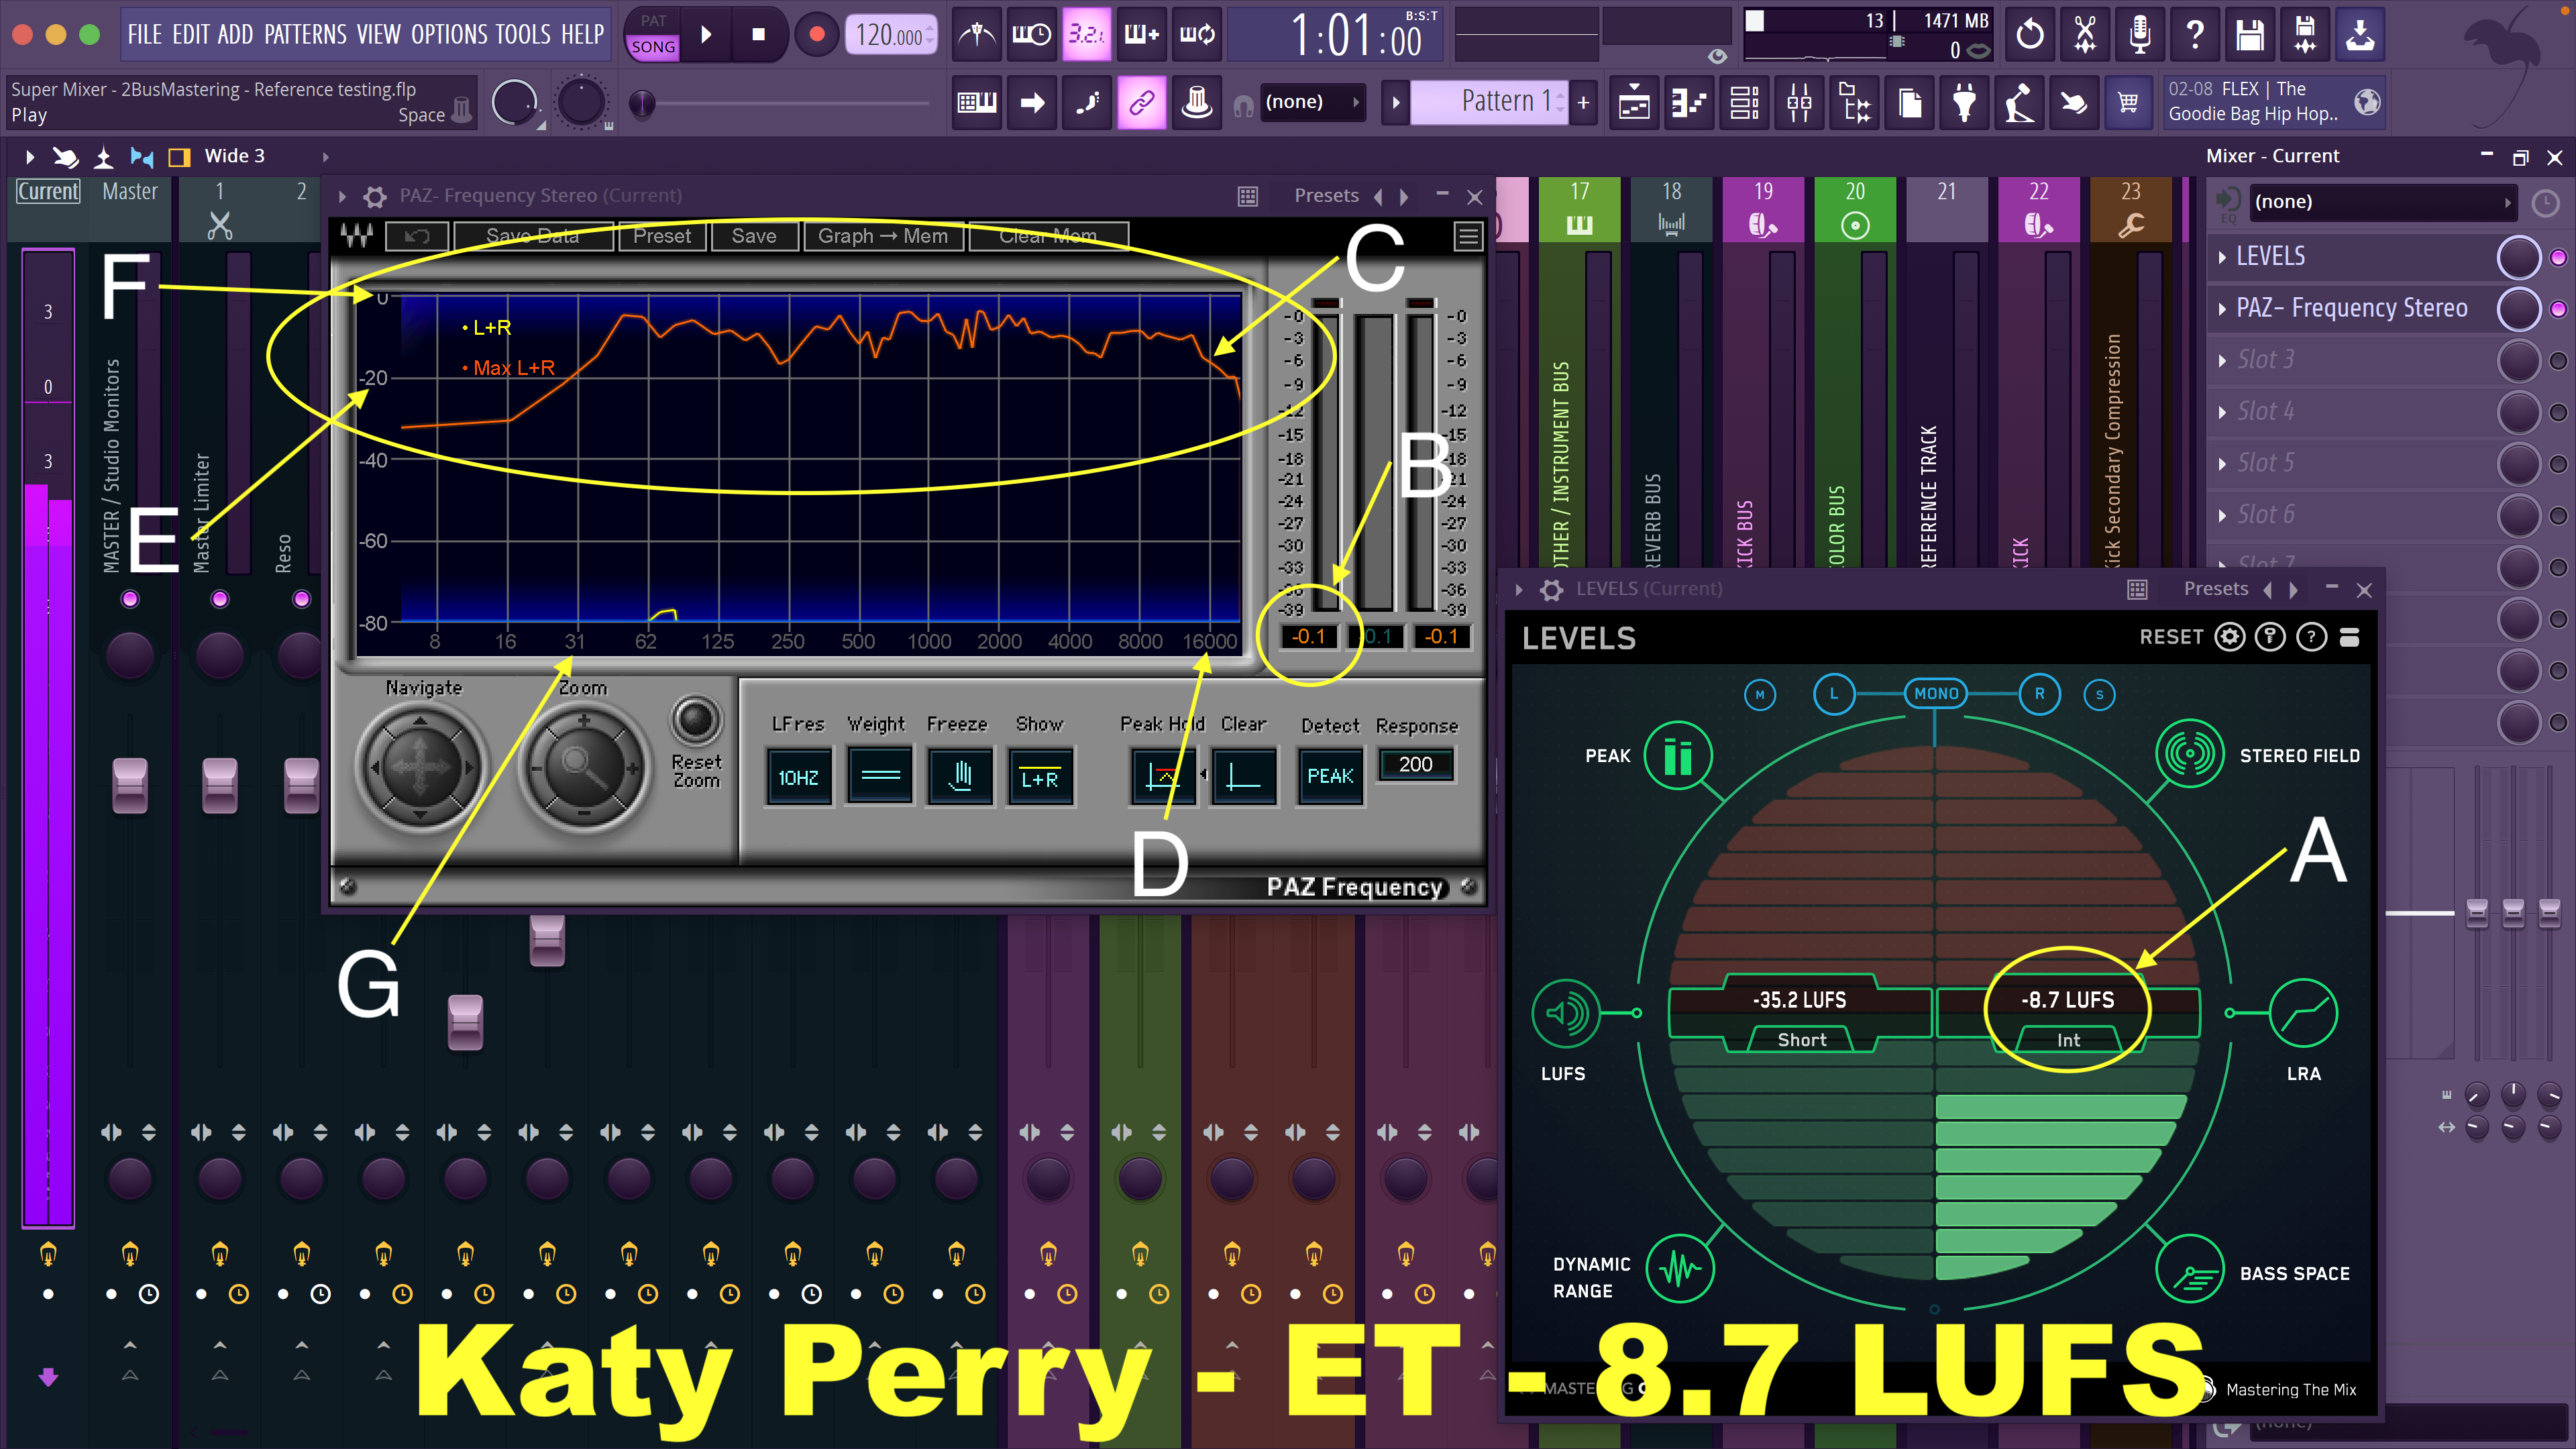
Again, here you see the top end of the frequency curve cross 16,000 khz down to about -18 db. Look at the bottom end, and notice that the low end frequency curve is down to about -20 db at 31 hz. This is similar to the first track by Britney Spears. Olivia Rodrigo’s track Brutal, has more low end and drops just a little bit lower in the frequency curve.
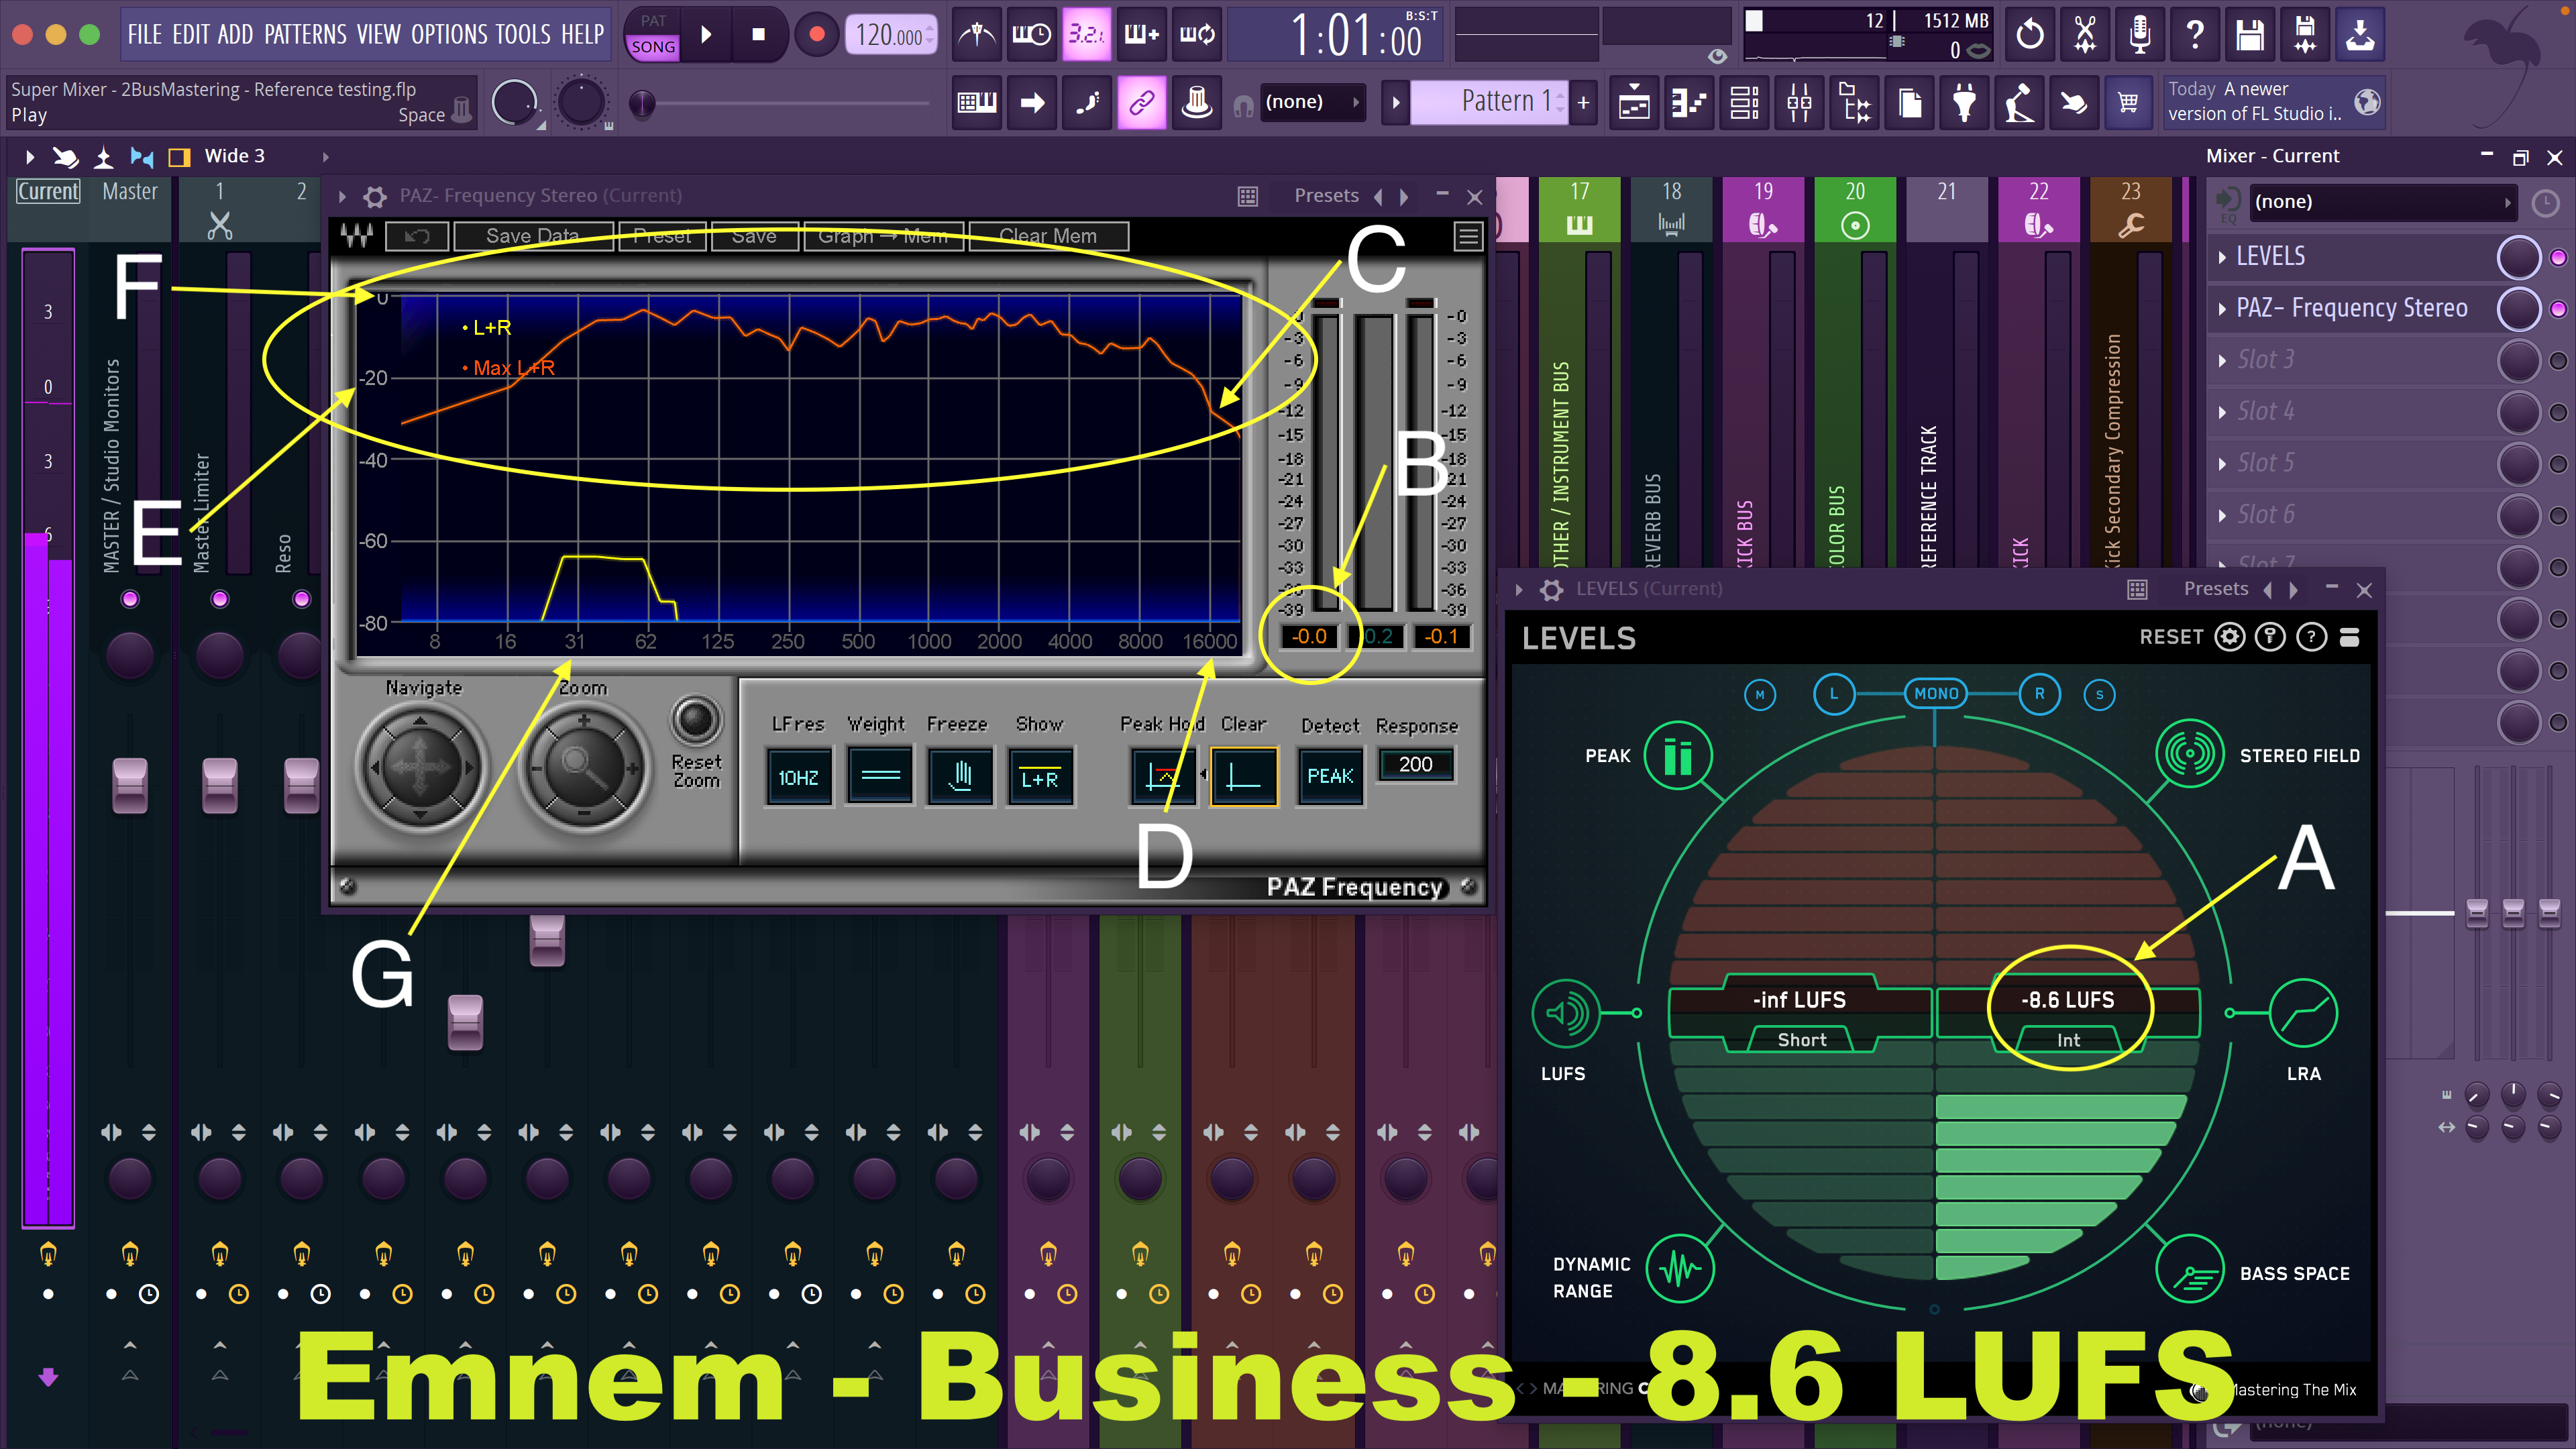
In this example by Emnem, you can see the top end is even steeper rolled off as we get to 16,000 khz. The bottom end is closer to the example by Olivia Rodrigo. The loudness or LUFS level are all similar, but tracks can get “louder”!
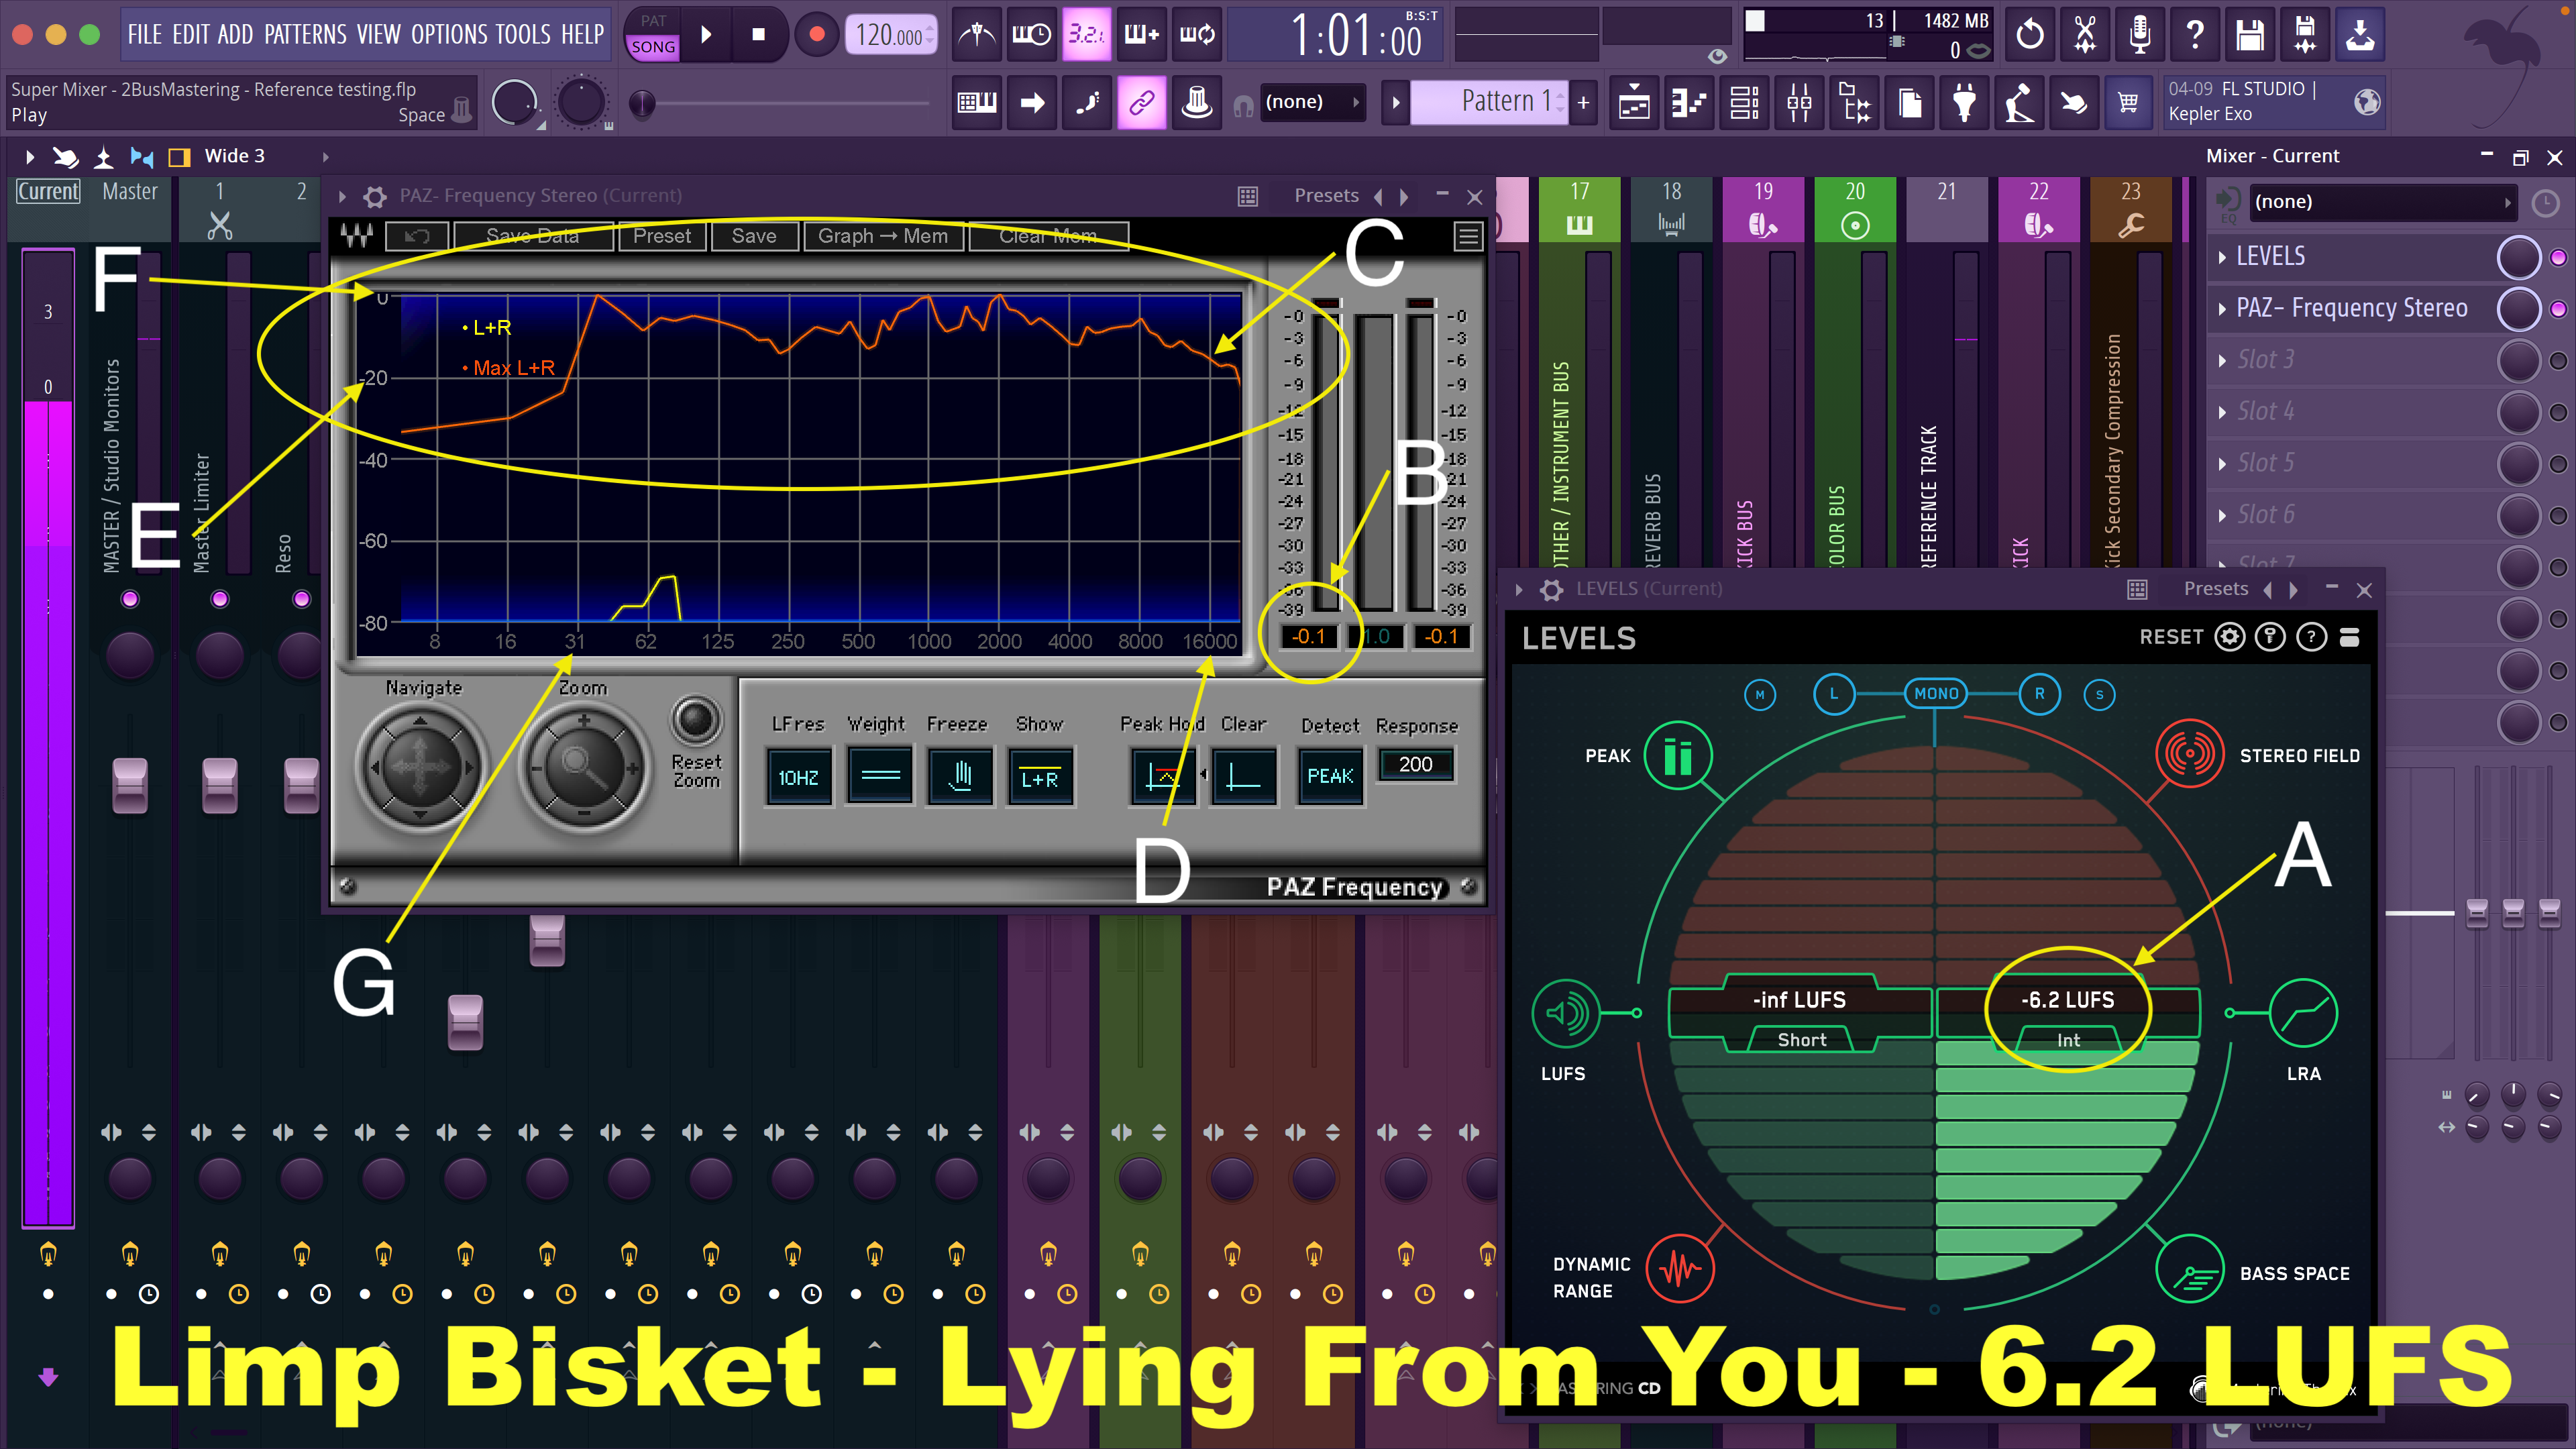
This track by Limp Bizkit is a couple of LUFS louder than the other tracks but share a similar frequency curve.
I have many more examples that I could share and compare to, but the point here is, for you to build your own library of examples, with your system, with the style of music you are going for.
NOTE: THIS IS NOT A MIXING TECHNIQUE.
This is intended to give you ways to get the bottom end of your mixes better, when your speaker system may not be full range, or you are mixing on headphones. Also keep in mind that these are finished and mastered tracks in these examples. In my system I mix and master in one pass, so as I approach the end of a mix, I check these meters often, to make sure the levels are within professional levels.
With that said, you can still have a bad mix that meets professional loudness levels and frequency curve. This is only part of the puzzle to getting a good mix that translates to many different systems.
Let’s switch it up, and talk about how you monitor with your speakers or headphones when mixing.
If you are like me, you like to have music loud. You want to feel the power of the music and have it surround you. Although, this may be fun, it isn’t good for mixing and setting the levels of individual instruments inside the overall mix.
The more level and signal that is driven through a speaker system, the more the speakers will suffer “speaker compression” and / or distortion. Speakers are more accurate at reproducing the audio waveform given, at lower levels. Speakers are moving in the air to reproduce the sound, and louder levels mean more and more physical movement needs to happen to achieve these higher sound pressure levels.
Think of a rock guitar player that turns up his guitar amp to drive his cabinet speakers. The sound not only gets louder, but the speakers themselves change the sound by no longer being able to reproduce the sound in the air accurately, and they distort, and round the waveform off, and compress the waveform. This gives the rock guitar it’s rounded off sound that we love and try to reproduce with plug-ins and various other methods.
This same phenomenon is present in any speaker system that is overdriven with power. Louder and louder levels will not reproduce the audio waveform accurately. Then of course, there is the quality of the speakers too. Speakers move air and perform a physical task. They are mechanical. All the parts and pieces that make up speakers influence that sound. With that said we have not even considered the power amp and all the influence on the signal it contributes to the equation. The variations are endless!
So what to do?
If you are mixing, the first step is to get to know YOUR speakers and / or headphones really well. Are what you have now adequate? Certainly we can all be seduced into wanting to get the latest and greatest new monitor setup out there, but does it make a better recording? No matter how cool they are, probably not. Let’s assume your speakers / headphones are good.
Wait, I just heard someone in the crowd say, cool, but what do you use?
Fair question. I knew with my current setup, I wasn’t going to have the full range system of yesteryear. I knew I would be using headphones for the most part, so I wanted good ones, but didn’t want to go crazy either. The headphones I use are the pair of HiFiMAN pictured at the very top of this page. I also use a dedicated separate headphone poweramp. And yes, they sound amazing! When I first starting using them, it was like having near field monitors with their open back design. I can hear much more detail in recordings with these than my modest Sony headphones we use for tracking sessions. But this is just part of my monitoring solution.
The second part of my monitoring solution is the CLA NX Studio simulation by Waves.
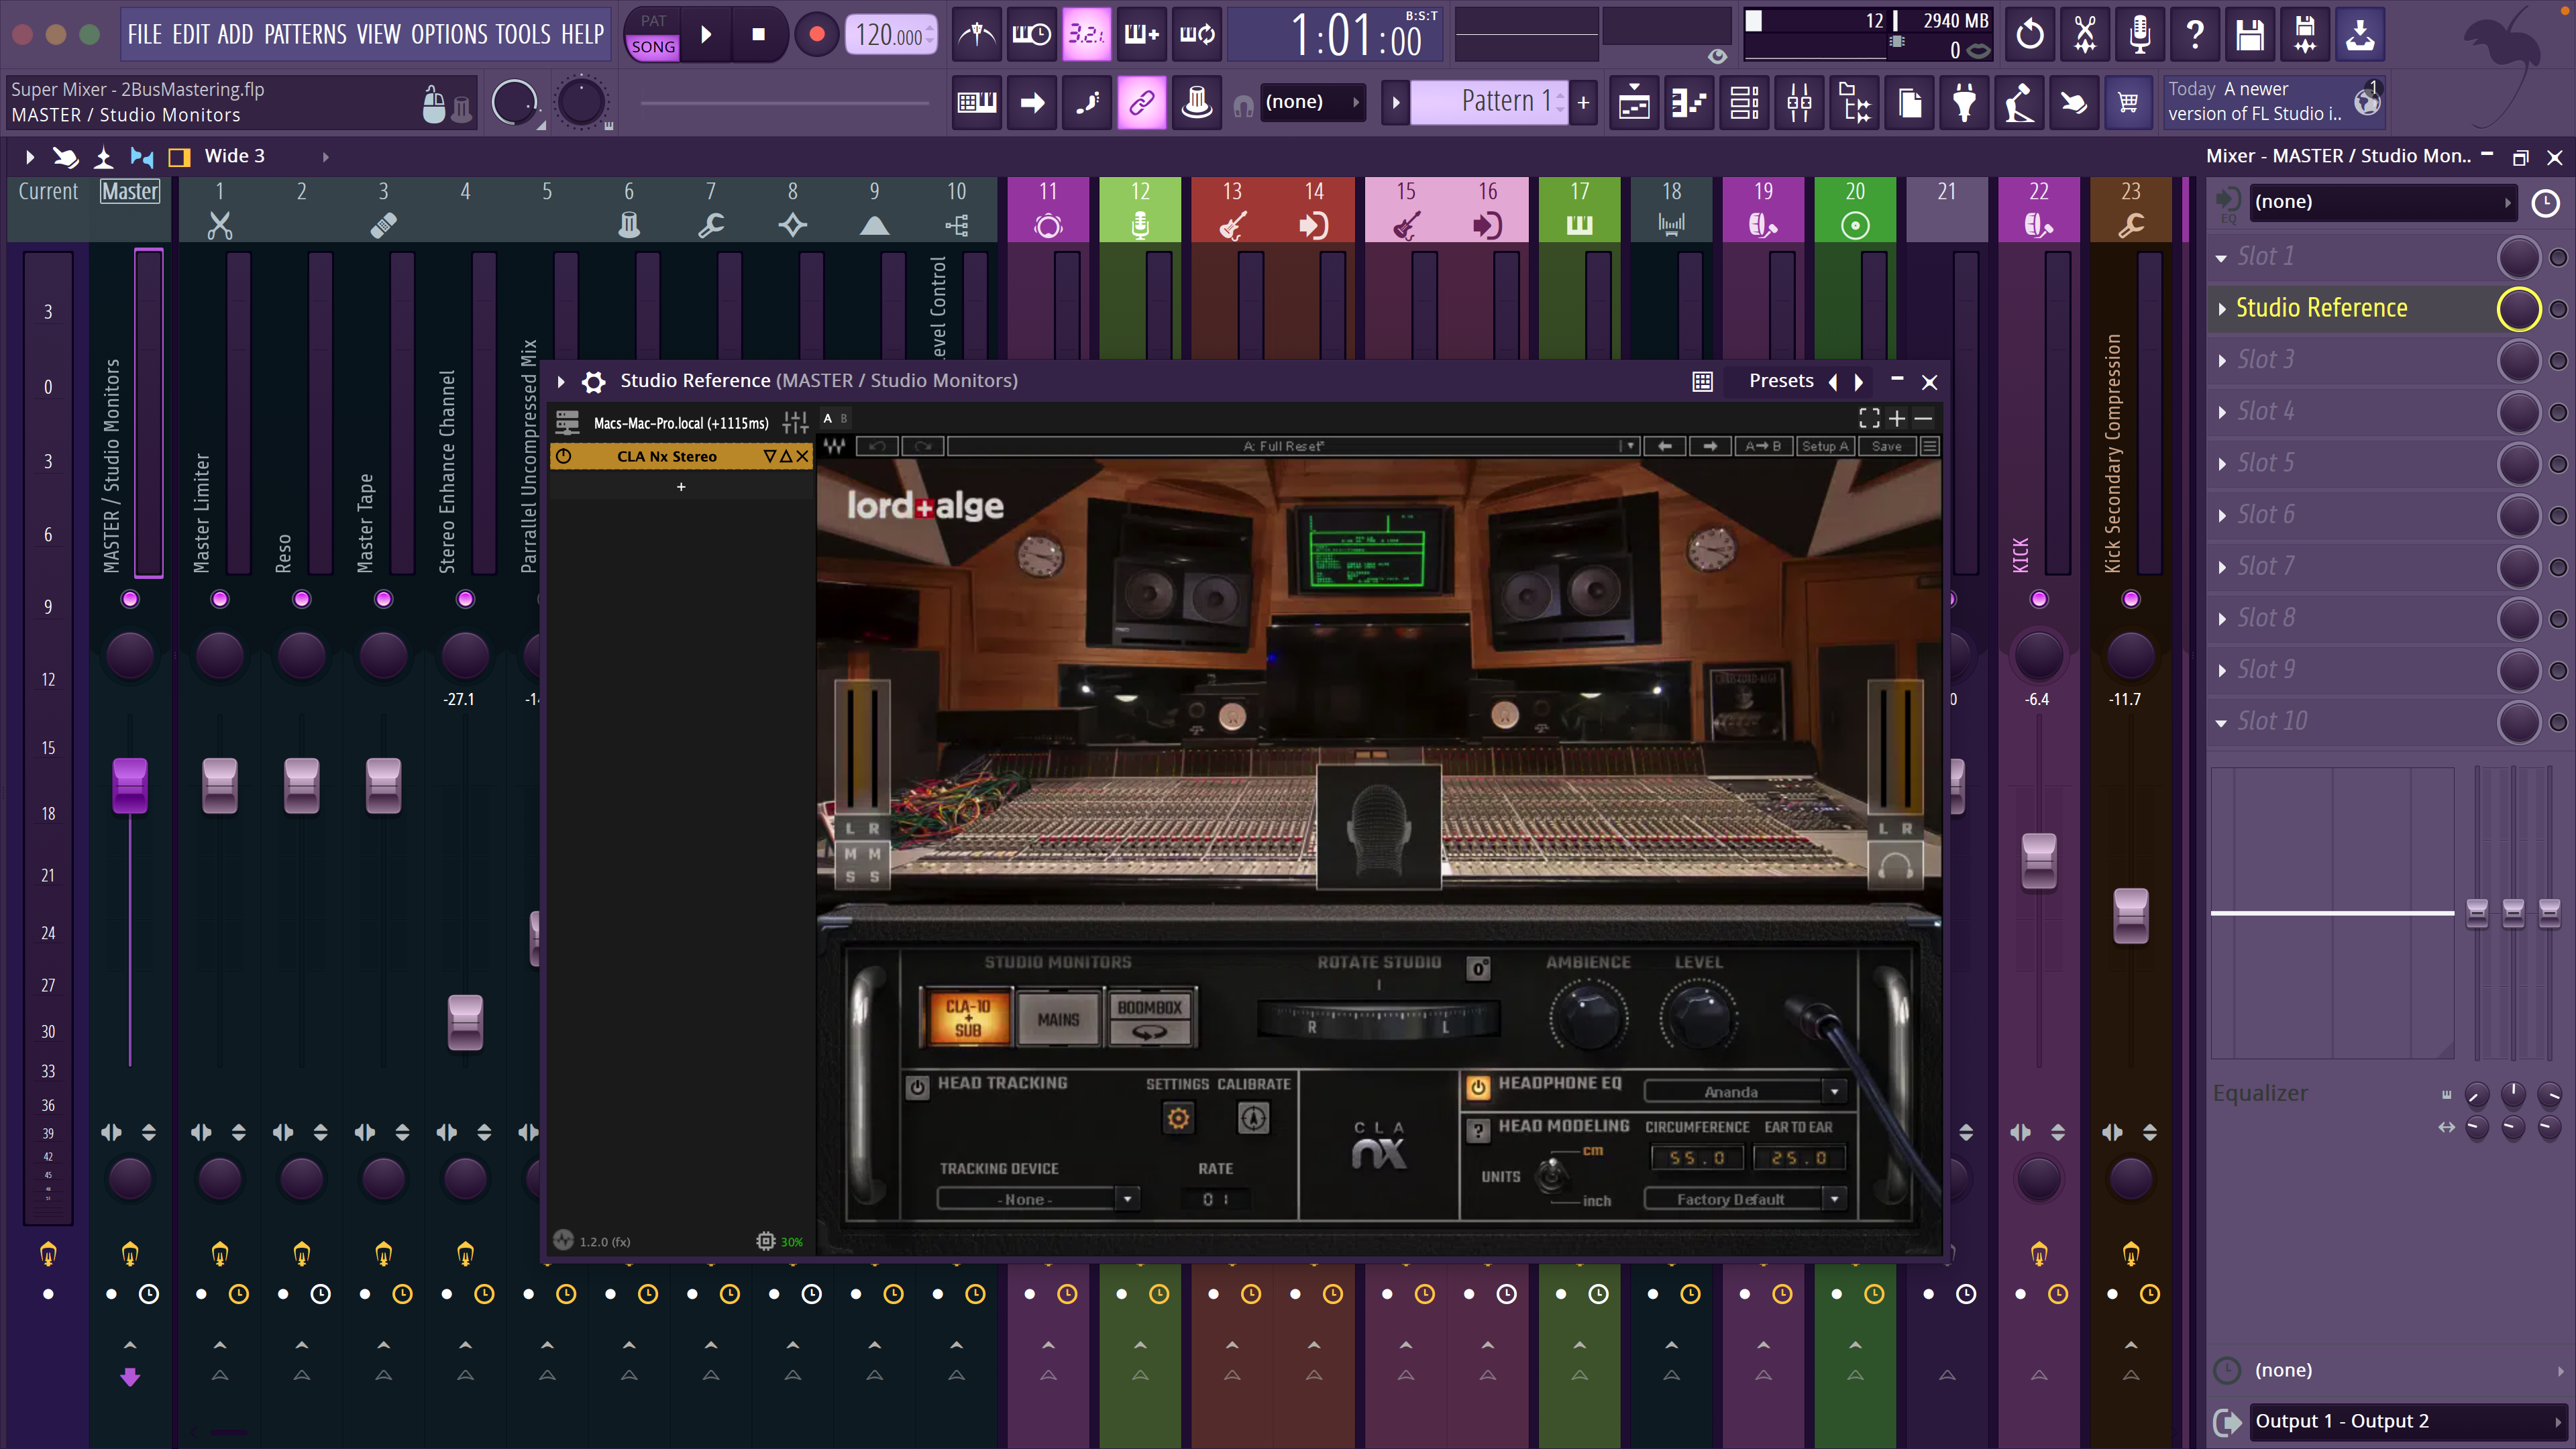
There certainly is talk about whether these type of plug-in simulations are a benefit or not, but I have found the one I use to be a useful tool in checking things when I think I have a mix close. Inside this simulation are three sets of “speakers”, and yes they all sound different as intended.
One of the things I have found to be very useful with this is checking the reverb and effects level of a mix. When mixing in the dry environment of headphones there is a natural tendency, (at least for me), to add more effects because there is no influence of a physical room on the audio. I have noticed that if I switch from the dry headphones to the NS-10s inside the simulation that the reverb becomes much more “alive” and sounds much closer to my personal car stereo. I have found that if I like the reverb level on the simulated NS-10s in the simulation that I will like it on my car stereo and other systems.
So my personal monitoring setup consist of 4 pieces:
1. My primary headphones.
2. The frequency analyzer and meters.
3. The studio simulation with three sets of speakers.
4. My car stereo. (Which is the final test and decision maker)! Right?
Before I end this lengthy article here I will give you one of the best mixing tips I was taught many years ago. When you think that you have, “the mix,” give your ears a few minute break, and then go back and listen to the mix as low as possible. Why? Remember above we talked about the physical movement of the speaker and that at lower levels the speaker is more accurate? Oh yeah…
When listening at low levels you will hear things that are now suddenly popping out of the mix that you didn’t hear before. A common one is now the kick level is too loud, because the speakers at louder levels were compressing the kick impact. Another one, is in the high frequency part of the spectrum, and suddenly the high hats are too loud in the mix. It could be anything really. Setting the final levels at a low volume listening level will give you a more balanced mix that will sound good at any level.
But, when I check things in my car stereo, I usually start off loud because I am excited to hear something on the car stereo, but it isn’t that accurate and I know it. So I typically go through multiple listening passes in the car especially if I am close to the final mix. I certainly do my super low volume pass, and note what is sticking out or out of balance. On my personal car stereo system, I have seen it will only reproduce the kick attack accurately up to about 75% of the amp volume. After that it starts to get compressed into the mix, as the speakers become overworked.
Okay, okay, as you can see I could go on and on here. So let’s just do a summary to wrap this page up.
Summary:
For me, my recording setup has never been the place where I normally just listen to music, so there has always been this disconnect, and why most of us want to check the mix in the car where we DO spend so much time listening.
So part of what I explain here is putting professional tracks through my recording setup so I have something definite to compare to through the same signal chain. The screen shots of the hit song frequency curves and LUFS I also have on my phone for a quick visual reference when I need it.
Bottom line, recording, mixing and mastering music is a complex process with infinite variables, and what I share here is just one of the possibilities.
